Effects of different browsing histories on the understory
|
Aim & scope - Where & when - How - Main results - Conclusion - Scientific Publications
|
Aim and scope
|
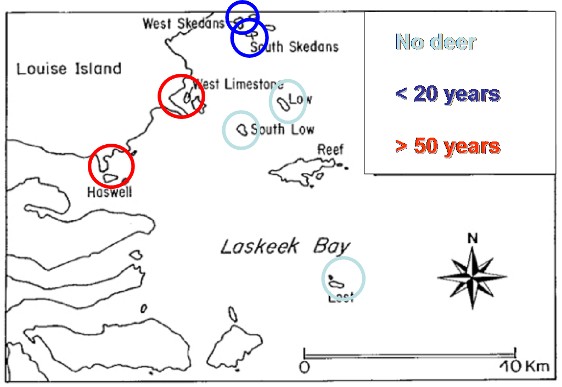
A dendrochronology study (see Estimating time since deer colonization) has shown that Laskeek Bay is a "natural laboratory" that consists of adjacent islands with
different browsing histories: no deer, deer present for less than 20
years, deer present for more than 50 years at time of study,
This situation allowed RGIS to study the relationship linking browsing history to vegetation diversity and structure in two
types of habitats:
- the forest understory (interior)
- the shoreline vegetation (forest edge)
|
Copyright Gow Gaia Institute
|
|
return to top of page
|
Where and when
|
In 2000, Steve Stockton and co-wokers sampled the vegetation in
permanent plots in the forest
interior and along the shoreline on 7 islands situated in Laskeek
Bay:
-
3 islands had never been colonised by deer: Low, Lost, South Low
-
2 had been colonised for less than 20 years: West Skedans, South Skedans
-
2 had been colonised for more than 50 years: West Limestone, Haswell.
|
|
return to top of page
|
How
|
15 plots were established on each island:
- In
the forest interior, 5 circular plots, 10 meters in radius, were placed at
least at 50 meters from the forest edge and from one another.
- On the shorelines, 10 circular plots, 10 meters in radius, were distributed randomly along the shoreline.
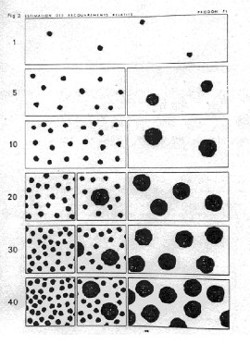
In order to describe vegetation diversity and to estimate plant
abundance we recorded the percent cover of each species per vegetation layer. |
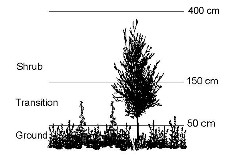
The vegetation layers were:
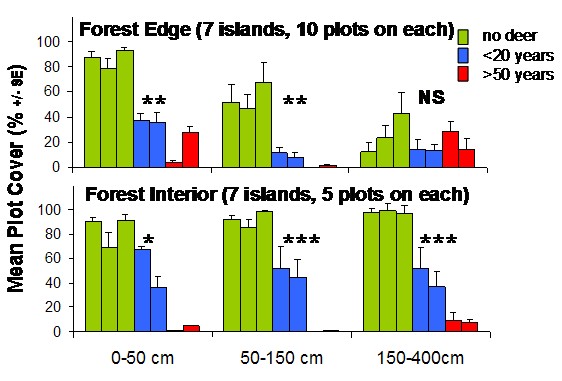
- ground: 0-50 cm
- transition: 50-150 cm
- shrub: 150-400 cm
Deer feed mainly between 0 and 150 cm but are also able to push shrubs over in order to reach the upper branches.
|
|
|
|
In
each strata and for each species, the observer estimated the percentage
of plot area that would be covered by the shadow cast on the ground by
the foliage present in the strata (any plant species with foliage
in different vegetation layers would thus be represented by several
percent cover estimates).
Percent cover was estimated with the help of a cover chart, like the one shown here.
|
|
|
return to top of page
|
Main Results
|
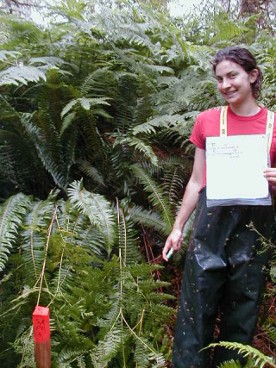
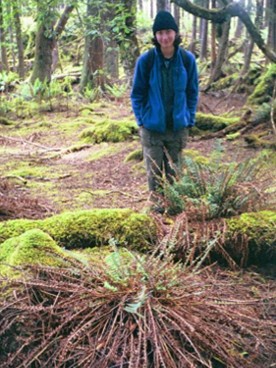
A simple visual comparison of forest interior or shorelines vegetation
between islands with and without deer already shows dramatic
differences in plant cover.
|
|
|
Sword ferns in forest interior on an island without deer (Lost)
|
Browsed and dead sword ferns in forest interior with deer (West Skedans) |
|
|
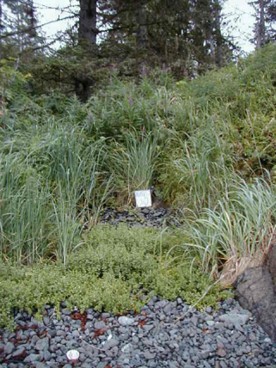
Grassy shoreline on an island without deer (Lost)
|
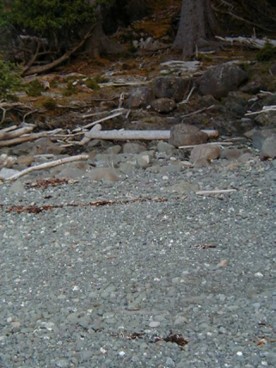
Barren shoreline on an island with deer (West Limestone)
|
An analysis of the vegetation samples collected showed
that changes in vegetation cover, diversity, structure and composition were associated with length of deer presence.
|
Changes in vegetation abundance associated to deer presence |
Overall vegetation cover often exceeded 80% in the lower vegetation
layers of forest interior plots on islands without deer and was less than 10% on the islands
with deer for more than 50 years.
|
|
Changes in vegetation diversity associated to deer presence
|
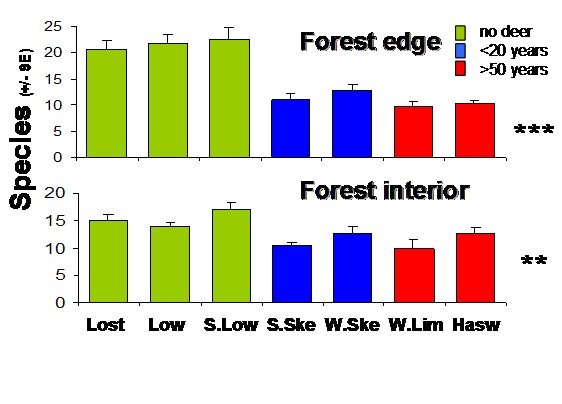
At the plot scale, plant species richness was about 20 to 50%
lower on islands colonized by deer than on islands without deer.
|
|
Changes in vegetation structure and composition associated to deer presence
|
A Principal
Component Analysis is a statistical procedure that allows to represent complex data
on community composition in a two dimensional space and relative to habitat
variables.
In this
analysis, vegetation plots have been positioned on the figure's plane according
to plant composition and percent cover. The closer a plot is to another on this plane
the more similar their understory vegetation.
We used different
symbols (squares and triangles) for plots from different habitats (forest
interior = squares, or forest edge = triangles) and different colours for
different browsing histories.
|
|
Plots with
positive scores on the horizontal axis are characterized by high values for
vegetation cover and species richness in the understory. Plots with negative
scores have low values for vegetation cover and species richness.
Plots with
positive scores on the vertical axis are rich in shrubs and ferns, those with
negative scores are rich in forbes or grasses.
|
|
This analysis
suggests that when time since deer colonisation increases:
- The
abundance of shrubs, ferns, and flowering plants decreases to the benefit of a
few herbaceous plants
- The
contrast in vegetation composition between the two types of habitats also
decreases when time since deer colonisation increases (the spread of the plots
is dramatically reduced)
|
|
Conclusion
|
The longer deer
are present on an island:
- The less vegetation
there is
- The lower
the diversity of vegetation
- The simpler
vegetation composition and structure
The
consequences for biodiversity are:
- a risk of
species loss
- altered
habitat with possible consequences on the fauna,
altered ecosystem
functions such as nutrient and water cycling
|
|
Scientific Publications
|
- Stephen A. Stockton, Sylvain Allombert, Anthony J. Gaston, Jean-Louis
Martin, 2005, A natural experiment on the effects of high deer densities on the native
flora of coastal
temperate rain forests, Biological Conservation 126 (2005) 118–128 –
PDF
- Martin J.L.,
Stockton S.A., Allombert S. and Gaston A.J. 2010. Top-down and
bottom-up consequences of unchecked ungulate browsing on plant
and animal diversity in temperate forests: lessons from a deer
introduction. Biological Invasions.
12 : 353-371 -
PDF
-
|
return to top of page |